시스템 트레이딩을 위한 나의 전략을 세우고, 이 전략을 과거 데이터에 대입하여 성과를 알아보며 검증하는 절차를 알아보자!
1. Backtrader
Welcome - Backtrader
Welcome to backtrader! A feature-rich Python framework for backtesting and trading backtrader allows you to focus on writing reusable trading strategies, indicators and analyzers instead of having to spend time building infrastructure. Open Source - GitHub
www.backtrader.com
Backtrader의 함수와 옵션은 홈페이지를 참고하시면 됩니다.
import backtrader as bt
from pykrx import stock
import pandas as pd
2. 백테스트 전략: 볼린저 밴드
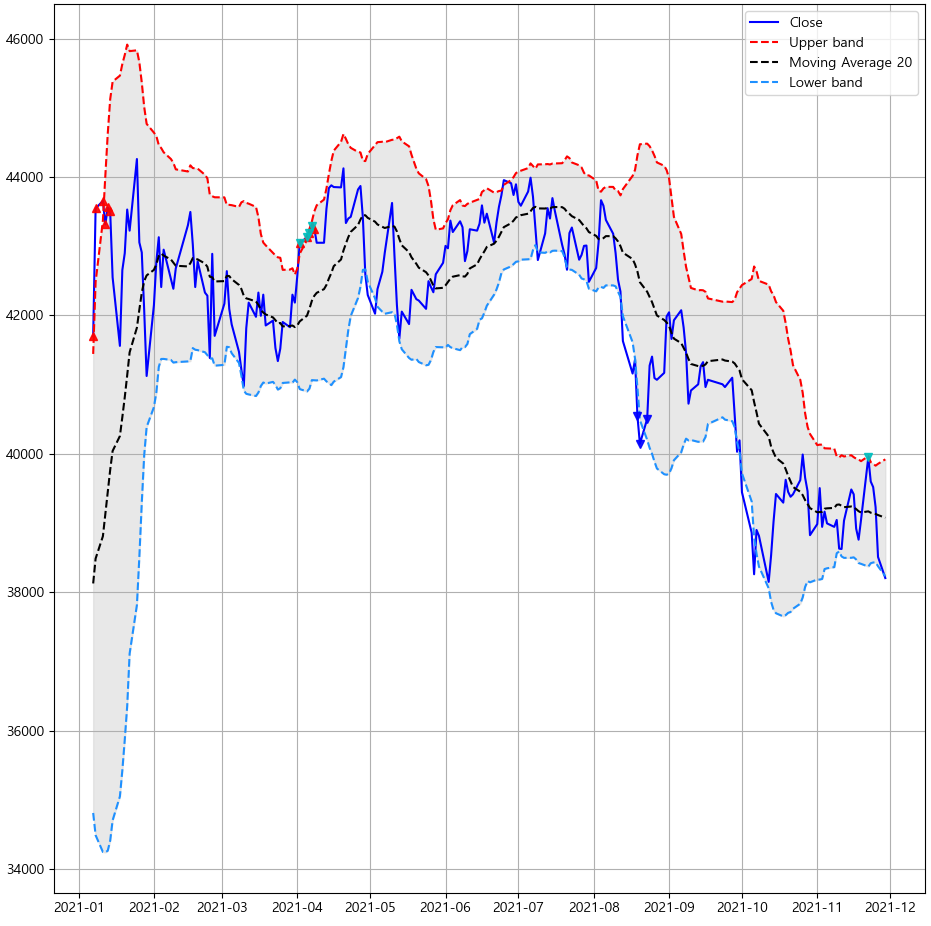
볼린저밴드는 20일 이동평균선을 기준으로 주가가 어느 위치에 있는지 알려줍니다.
볼린저밴드 상단선: 20일 이동평균선 + 2 * 표준편차
볼린저밴드 하단선: 20일 이동평균선 - 2 * 표준편차
(예시)
그래서,
첫 번째 전략은 볼린저 밴드 하단선에서 매수하고, 볼린저 밴드 중간선에서 매도한다는 것입니다.
(본 전략은 코드 작성과 공부를 위한 임의적 설정이므로, 수익을 대변하지 않습니다.)
3. 코드1: Backtrader Strategy
class SmaCross(bt.Strategy): # bt.Strategy를 상속한 class로 생성해야 함.
params = (
("period", 20),
("devfactor", 2),
("debug", False)
)
def log(self, txt, dt=None):
''' Logging function fot this strategy'''
dt = dt or self.data.datetime[0]
if isinstance(dt, float):
dt = bt.num2date(dt)
print('%s, %s' % (dt.isoformat(), txt))
def __init__(self):
self.boll = bt.indicators.BollingerBands(period=self.p.period, devfactor=self.p.devfactor, plot=True)
def next(self):
global size
if not self.position: # not in the market
if self.data.low[0] < self.boll.lines.bot[0]:
bottom = self.boll.lines.bot[0]
size = int(self.broker.getcash() / bottom) # 최대 구매 가능 개수
self.buy(price=bottom, size=size) # 매수 size = 구매 개수 설정
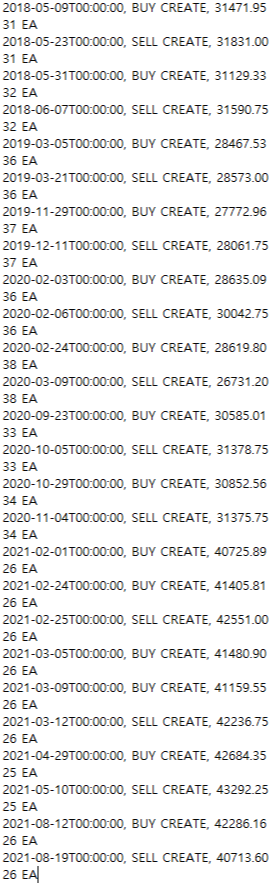
self.log('BUY CREATE, %.2f' % (bottom))
print(size, 'EA')
else:
if self.data.high[0] > self.boll.lines.mid[0]:
self.sell(price=self.boll.lines.mid[0],size=size) # 매도
self.log('SELL CREATE, %.2f' % (self.boll.lines.mid[0]))
print(size, 'EA')
params = (
("period", 20),
("devfactor", 2),
("debug", False)
)
# 볼린저 밴드에 사용할 이동평균 일 수와 표준편차에 곱할 상수를 정의합니다.
def log(self, txt, dt=None):
# 프롬프트에 매수 or 매도, 매수매도 가격, 개수를 출력합니다.
self.boll = bt.indicators.BollingerBands(period=self.p.period, devfactor=self.p.devfactor, plot=True)
# 볼린저 밴드 indicators를 가져옵니다.
if not self.position: # not in the market
# 매수한 종목이 없다면,
if self.data.low[0] < self.boll.lines.bot[0]:
# 저가 < 볼린저 밴드 하한선 이면,
size = int(self.broker.getcash() / bottom) # 최대 구매 가능 개수
# size는 매수 또는 매도 개수로, 현재 금액에서 타겟가격으로 나누어줍니다.
# 볼린저 밴드 하한선에서 구매 시 최대 구매 가능 개수
self.buy(price=bottom, size=size) # 매수 size = 구매 개수 설정
# 매수
self.log('BUY CREATE, %.2f' % (bottom))
# 프롬프트에 출력
if self.data.high[0] > self.boll.lines.mid[0]:
# 고가 > 볼린저 밴드 중간선이면,
self.sell(price=self.boll.lines.mid[1],size=size) # 매도
34번째 줄: 매도 (20일 이동평균선에서 매도 = 볼린저 밴드 중간선)
5. 코드2: 시가, 고가, 저가, 종가, 거래량 불러오기
size=0
stock_name = "KODEX 200"
stock_from = "20171125"
stock_to = "20211125"

# 전체 종목코드와 종목명 가져오기
stock_list = pd.DataFrame({'종목코드':stock.get_etf_ticker_list(stock_to)})
stock_list['종목명'] = stock_list['종목코드'].map(lambda x: stock.get_etf_ticker_name(x))
stock_list.head()

ticker = stock_list.loc[stock_list['종목명']==stock_name, '종목코드']
df = stock.get_etf_ohlcv_by_date(fromdate=stock_from, todate=stock_to, ticker=ticker)
df = df.drop(['NAV','거래대금','기초지수'], axis=1)
df = df.rename(columns={'시가':'open', '고가':'high', '저가':'low', '종가':'close', '거래량':'volume'})

df["open"]=df["open"].apply(pd.to_numeric,errors="coerce")
df["high"]=df["high"].apply(pd.to_numeric,errors="coerce")
df["low"]=df["low"].apply(pd.to_numeric,errors="coerce")
df["close"]=df["close"].apply(pd.to_numeric,errors="coerce")
df["volume"]=df["volume"].apply(pd.to_numeric,errors="coerce")

data = bt.feeds.PandasData(dataname=df)
cerebro = bt.Cerebro()  # create a "Cerebro" engine instance
cerebro.broker.setcash(1000000)
cerebro.broker.setcommission(0.00015)   #0.015% 수수료

cerebro.adddata(data)  # Add the data feed
cerebro.addstrategy(SmaCross)  # Add the trading strategy
cerebro.run()  # run it all
cerebro.plot(style='candlestick',barup='red',bardown='blue',xtight=True,ytight=True, grid=True)  # and plot it with a single command
stock_name = "KODEX 200"
stock_from = "20201230"
stock_to = "20211130"
# 조회할 ETF와 날짜를 입력합니다.
stock_list = pd.DataFrame({'종목코드':stock.get_etf_ticker_list(stock_to)})
stock_list['종목명'] = stock_list['종목코드'].map(lambda x: stock.get_etf_ticker_name(x))
# stock_to 에 해당하는 날짜에 존재하는 ETF를 불러옵니다.
# 개별 종목은 get_market_ticker_list(market="ALL") 함수를 확인해주세요!
6. 결과

본인의 전략을 만들어 백테스팅해보세요!
(본 전략은 코드 작성과 공부를 위한 임의적 설정이므로, 수익을 대변하지 않습니다.)
궁금한 부분은 댓글로 남겨주세요.
'컴퓨터 > Python' 카테고리의 다른 글
| [Python] 파이썬, Matplotlib 실시간 주식 차트 업데이트 자동화 만들기 (6) | 2022.01.06 |
|---|---|
| [Python] 파이썬, 주식 차트와 보조지표 그리기 (Plotly) (0) | 2021.12.20 |
| [Python] 파이썬, 투자할 주식 종목 자동으로 추려보자! (0) | 2021.11.22 |
| [Python] 파이썬, HTML로 카카오맵 api 해상도 높은 큰 지도 만들기 (0) | 2021.11.18 |
| [Python] 파이썬, 로컬 서버 localhost 간단하게 만들기(터미널, 코드) (0) | 2021.11.13 |


